
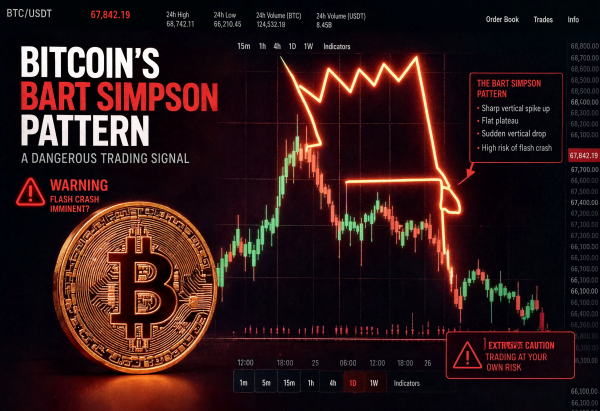
[DigitalToday reporter Jinju Hong (홍진주)] Bitcoin is moving sideways in the $77,000 range after a sharp jump in August, heightening market caution over the risk of a steep drop. The current chart, trading within a narrow range after the surge, could lead to a so-called “Bart Simpson” pattern in which prices plunge and return to their original level, analysts say.
On Sept. 2 (local time), blockchain outlet Decrypt reported that bitcoin rose about 25 percent in six trading days, from about $64,420 on Aug. 19 to about $80,700 on Aug. 25. After giving back part of those gains, it is now hovering around $77,470 and continuing a sideways, weakening trend.
With a tight range persisting after the surge, the market is again discussing a “Bart Simpson” pattern. The Bart Simpson pattern is not an official technical indicator but a term describing the shape of a chart. It refers to prices moving sharply in one direction, then trading sideways in a narrow band for a period, before quickly returning toward the starting point.
Applied to the current bitcoin move, the pattern would be completed only if a sharp drop occurs that gives back most of the August gains in a short time. That means a simple correction or gradual decline would be hard to view as a complete pattern.
Still, short-term technical indicators do not clearly point to an immediate crash. On a four-hour chart, the relative strength index (RSI) is 44.8, leaning bearish, but it has not entered the oversold zone typically seen during sharp breakdowns. The ADX, which measures trend strength, is also around 22, making it difficult to say a clear direction has formed.
Compressed volatility is cited as a risk factor. The squeeze momentum indicator is signaling weakening momentum along with a bearish signal. That suggests a large price move could occur, but the direction is not yet determined, according to the analysis.
A move lower could bring the chart closer to a Bart Simpson pattern, but a break above resistance could also extend the existing uptrend. In particular, the 50-period exponential moving average remains above the 200-period line, meaning the medium- to long-term bullish structure is still intact.
The price level drawing the most attention from market participants is $75,800. If bitcoin falls below that level, the bearish scenario could gain traction. If it holds that level, concerns about the current downtrend pattern could ease.
A completed Bart Simpson pattern would require a shock stronger than simple selling pressure. That would mean a situation in which leveraged positions are liquidated in a chain and the price drops sharply in a short time. Bitcoin has seen past episodes of sharp declines driven by cascading leverage liquidations, but the four-hour chart does not yet show a clear signal of such a breakdown.
September seasonality adds weight to the bearish view. Since 2013, bitcoin has ended September lower in 8 of the most recent 13 Septembers, with an average return of -2.97 percent. The market refers to this seasonal tendency as “Red September.”
In September this year, a U.S. Federal Reserve decision on the policy rate is also scheduled. Ahead of the Federal Open Market Committee meeting on Sept. 15 to 16, CME FedWatch is pricing in about a 64 percent chance of a rate hike.
Fund flows are also a burden. Bitcoin spot ETFs saw about $236 million in outflows on Sept. 1 alone. Tensions near the Strait of Hormuz have also risen after a new clash between the United States and Iran, pushing international oil prices to the low $90s a barrel. If higher oil prices raise inflation pressure and lead to higher interest rates, it could also weigh on bitcoin, which is a risk asset.
Still, it is difficult to conclude that current market conditions will directly lead to a flash crash. Some also raise the possibility of a prolonged correction instead of a sharp drop. Based on the downtrend line from the August high of about $80,626, one scenario is that bitcoin could decline gradually to the $62,000 range over about 8 weeks rather than plunging within hours.
Both scenarios could involve a substantial decline, but the path of price movement would differ significantly. One is a sharp breakdown accompanied by leverage liquidations, and the other is a gradual correction over an extended period.
Ultimately, the short-term issue narrows to one question. It is whether bitcoin holds $75,800 and maintains its bullish structure, or enters a gradual downtrend amid September’s seasonal weakness and interest-rate variables. For now, with the chart showing mixed signals, the market remains in a caution phase over downside risk rather than a confirmed sharp drop.
 Jinju Hong
hongjj@d-today.co.kr
Jinju Hong
hongjj@d-today.co.kr