[Digital Today reporter Yoonseo Lee] Can investors use a bitcoin liquidation heatmap to gauge price swings in advance?
On June 5 (all times local), blockchain media outlet the Crypto Basic noted that a liquidation heatmap can help identify zones where bitcoin is more likely to see sharp price moves. It said that checking the price levels where leverage positions are concentrated can help gauge where the market may wobble before a sharp drop or surge.
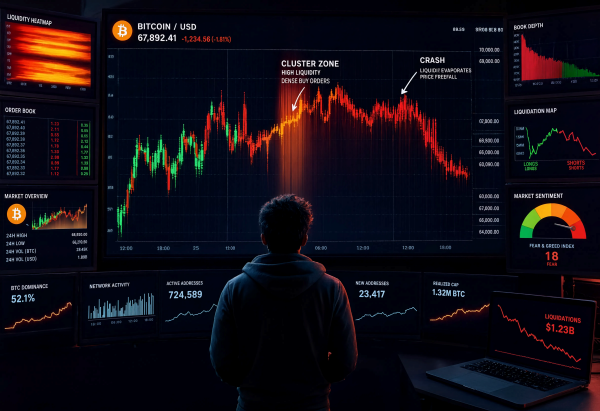
A liquidation heatmap is a tool that overlays exchange data such as open interest, leverage ratios and margin levels on a price chart using colors. When liquidation volume clusters at specific price levels, those zones can act as hidden liquidity in the market. If bitcoin reaches such a level, many positions can be closed at once, and the impact can lead to further liquidations, increasing price volatility.
There are real examples. In the first week of February, bitcoin fell from about $79,000 to $60,100, and more than $3 billion worth of bitcoin positions were liquidated in the process. At the time, a large liquidation cluster zone had already formed in the $60,000 to $65,000 range.
On Feb. 23, a single $61.5 million bitcoin long position was liquidated on HTX. Over the next 24 hours, $468 million worth of liquidations occurred across the overall crypto market, affecting more than 137,000 people.
The first thing to watch is the heatmap color. The colors indicate the intensity of liquidation clustering. Major platforms such as CoinGlass mark blue and purple as low-density zones, and yellow and white as high-density zones. A bright yellow band can be read as a potential price target zone. It said markets often move toward these high-liquidity zones first and then change direction.
By contrast, blue and purple zones have relatively few liquidation orders. In such cases, the price is relatively more likely to pass through without major resistance. For beginner investors, these can be seen as zones where sudden liquidation cascades are less likely to occur. If the current price is just below a large short liquidation zone, they should watch upside breakout potential and volatility intensity more closely than they would by looking only at standard charts.
How the tools are used also differs by platform. CoinGlass compiles data from major exchanges including Binance, OKX, Bybit and Bitget to show a liquidation map for the broader bitcoin derivatives market. Hyblock Capital reflects current liquidity conditions and also estimates market impact if a specific liquidation zone is reached.
TensorCharts combines real-time order flow and volume analysis and is suited to short-term trading. TradingLite is strong on an intuitive interface that beginners can easily read. CryptoQuant also provides on-chain indicators such as exchange inflows and miner activity, focusing on checking whether liquidation flows align with actual supply-and-demand changes.
TradingView, by contrast, does not include a basic liquidation heatmap function. It is strong in technical analysis, indicators and drawing tools, but does not provide its own liquidation data infrastructure. For beginner investors, it recommends first checking liquidation zones with the free version of CoinGlass and then supplementing related signals using TradingView scripts.
Still, it is risky to enter trades based on a liquidation heatmap alone. The heatmap shows where price could move, but it does not tell when it will move or whether it will actually reach those levels. Investors should first look at broader time frames than 1-minute or 5-minute candles, interpret the heatmap alongside other indicators and prioritize risk management.
A liquidation heatmap is a tool that visually shows the leverage pressure that moves bitcoin prices. Large liquidation zones can help gauge in advance the price levels where sharp drops or surges may occur. But because a heatmap does not confirm direction or timing, beginner investors should use it as a supplementary tool alongside price charts, trading volume and market sentiment indicators.