
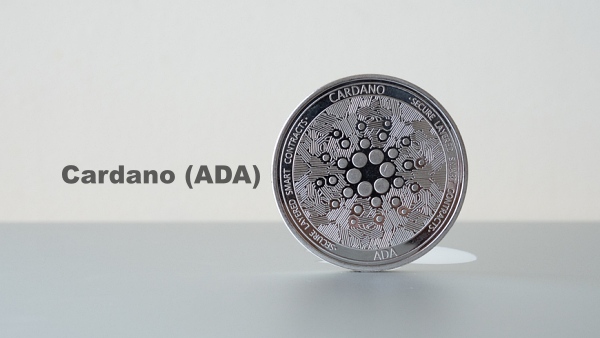
Cardano (ADA) is trying to break above a recent high near $0.269 after breaking through a downward resistance line on the four-hour chart.
As of Oct. 5 (local time), blockchain outlet The Crypto Basic reported that the market is watching whether the former resistance zone of $0.258 to $0.260 can establish itself as a new support level. Holding this range is a key variable that will determine whether the short-term uptrend can continue.
ADA first moved above the top of a descending trend line and then broke through $0.264, a reference price on the chart. On CoinMarketCap, the price rose to around $0.268. The market has entered a turning point to gauge whether the recent rise is only a temporary rebound or leads to further gains.
The earlier downtrend began after ADA formed a peak around $0.265 to $0.266 on Sept. 26. Each rebound after that produced a lower high, and the lows also moved down. The price moved between two descending trend lines, and this pattern continued into early October.
A change emerged in the $0.243 to $0.245 range. After ADA formed a base at those levels, buying interest flowed in and it recovered the $0.250 line, with the rebound extending to the top of the descending trend line. It then moved above the $0.258 to $0.260 zone where the downward resistance line had been, showing signs of breaking out of the earlier pattern.
The first resistance zone on the upside is $0.267 to $0.269, where the upper wicks of recent candles cluster. If the price breaks clearly above this level, the next area to watch is $0.275. From the chart reference price of $0.264 to $0.275, the upside potential is about 4.2 percent.
For the rally to continue, it is also important to confirm support when the price is pushed back. The market is watching the possibility that ADA may retest the $0.258 to $0.260 zone. If it blocks declines in that range, the former resistance could turn into support, raising confidence in the breakout. If it instead falls below that zone and re-enters the prior downtrend range, the short-term bullish scenario could lose force.
If the price declines further, the $0.250 to $0.253 range is cited as the next support area. If buying fails to support the price there as well, the pullback could widen to around $0.245. That would mean giving back a significant part of the gains secured during the recent breakout.
The near-term focus is whether $0.258 to $0.260 holds as support and whether the price breaks above the peak near $0.269. ADA has moved above the downward resistance line, but it is too early to conclude a trend reversal based on that alone. If it confirms support during a pullback and breaks above the recent high, the case for further gains is expected to strengthen.
 Yoonseo Lee
yslee@d-today.co.kr
Yoonseo Lee
yslee@d-today.co.kr