
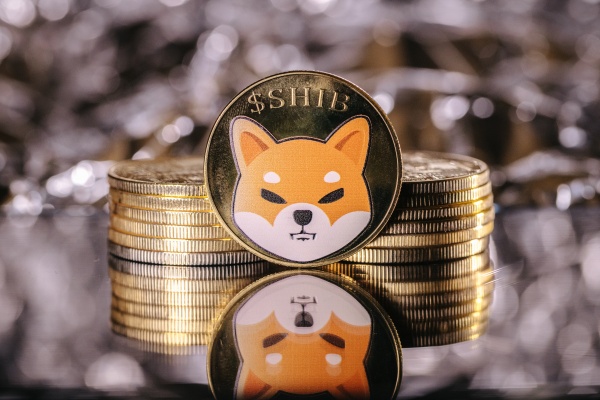
[Digital Today reporter Jinju Hong] Shiba Inu (SHIB) is showing signs of slowing buying interest after a strong rebound accompanied by a sharp surge in trading volume, blockchain outlet U.Today reported on July 27.
SHIB’s trading volume recently rose by almost 12 times, producing one of its strongest one-day gains in months, but recent daily charts show signs of fatigue.
SHIB quickly pushed higher after breaking out of a long consolidation range, but market sentiment appears to be splitting again after the rise. Recent candles show buying pressure fading quickly, and there is a view that profit-taking may be entering a zone where it can outpace short-term demand. The outlet pointed to this, saying, "Buyers appear to be losing momentum."
The key driver behind the rebound is the volume spike. Over the past few months, volume jumped enough to surpass all previous sessions. Such surges can mark the start of a longer-term trend reversal, but they can also coincide with the peak of a short breakout move. After SHIB pulled back once from an intraday high, the market is focusing on whether it can hold support regained during the rebound.
In the short term, the first price level to watch is $0.00000500, where the 100-day exponential moving average sits. SHIB stayed below this resistance for months but recently moved above it, and it has now become the most important short-term support. If buying holds above this level despite the day’s decline, the breakout move can be seen as still intact from a technical perspective.
The next inflection point is around $0.00000600, where the 200-day exponential moving average is located. This area is acting as a major medium- to long-term resistance. The outlet said a clear move above this line on a daily closing basis is needed for a meaningful structural shift to bullishness for the first time since early this year. If it breaks above the 200-day line, the likelihood could increase of an inflow of market participants seeking additional momentum.
Downside risks also remain. If SHIB slips below $0.00000445, it would mean the short-term moving average zone that supported prices before the recent breakout has broken down. In that case, much of the recent technical improvement could be reversed. U.Today said losing this area would raise the likelihood that the recent rally was driven more by short-position liquidations than sustained spot demand.
Momentum indicators are also cited as a burden. The relative strength index, or RSI, moved above 70, entering overbought territory for the first time in months. Overbought conditions do not immediately mean a reversal lower, but after an unusual volume spike, they often appear along with a cooling phase in the rally. The outlet also assessed, saying, "Technically, SHIB is still stronger than a few days ago, but the easy part of the rally is likely over."
Ultimately, SHIB’s next direction is likely to be decided at two price levels. If it holds support at $0.00000500, there is still room for the breakout to extend, but if it then fails to clear the 200-day line near $0.00000600, the rebound may again be limited to a constrained recovery. If it slips below $0.00000445, it may enter a phase where the nature of the recent rise itself needs to be reassessed.
 Jinju Hong
hongjj@d-today.co.kr
Jinju Hong
hongjj@d-today.co.kr